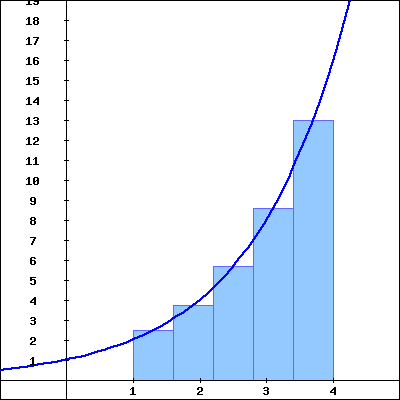
The five rectangles in the graph below illustrate a
???
left endpoint
right endpoint
midpoint
(select a description)
Riemann sum for on the interval .
The value of this Riemann sum is
.
Riemann sum for on