a) The rectangles in the graph below illustrate a
Riemann sum for
on the interval .
The value of this Riemann sum
is
,
and this Riemann sum is an
the area of the region enclosed by , the x-axis,
and the vertical lines x = 4 and x = 8.
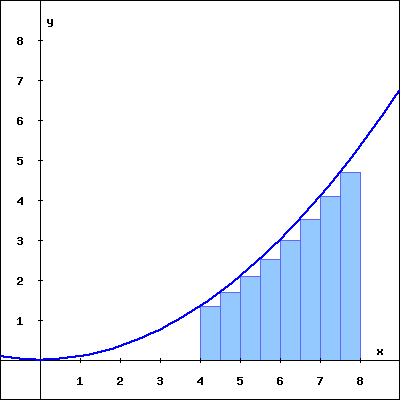 |
| Left endpoint Riemann sum for on
|
b) The rectangles in the graph below illustrate a
Riemann sum
for on the interval
.
The value of this Riemann sum is
,
and this Riemann sum is an
the area of the region enclosed by ,
the x-axis, and the vertical lines x = 4 and x = 8.
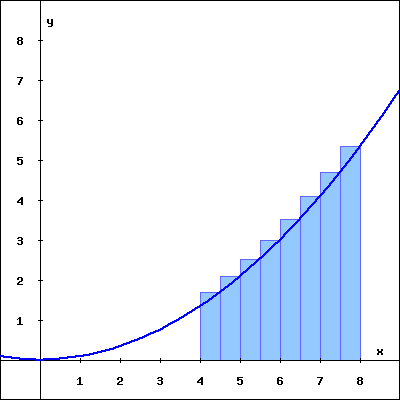 |
| Right endpoint Riemann sum for on
|