The velocity of an object was measured using a laser radar gun. The following data were collected.
| time (sec) | 0 | 1 | 2 | 3 | 4 | 5 | 6 | 7 | 8 |
| velocity (feet/sec) | 4 | 1 | 2 | 3 | 4 | 4 | 0 | 0 | -3 |
You decide to plot these velocity data and connect successive data
points with lines, as in the following graph. This graph determines a
function that approximates the actual velocity
function , which is unknown. By connecting data
points with lines in the graph you are assuming that velocity is
changing at a constant rate over one-second time intervals (or,
equivalently, that acceleration is constant over one-second time
intervals). This assumption may be incorrect because the actual rate
of change of velocity may not be constant over one-second time
intervals. However, you decide to use this graph anyway since it
seems like a reasonable approximation to the actual velocity.
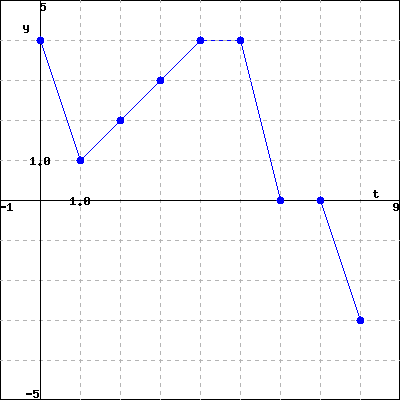 |
| Graph of approximation to velocity |
Using this graph, you can estimate the displacement of the object after seconds have elapsed by the value of the function
(A) Using the function , answer the following questions about how far the object traveled. Your answers must include the correct
units.
Displacement after 6 seconds =
Total displacement =
Total distance traveled =
(B) From the graph above, indicate the time interval or union of time intervals where the object is moving forward, backward, and is stationary. Enter your answer using
interval notation.
Forward:
Backward:
Stationary: